jQuery was a monumental discovery for me. After some years of cross-browser frustrations, woeful adherence of browsers to standards, and what seemed like stagnation in Web Development with regard to browser advancement, jQuery was a light in the darkness!
jQuery was and is exciting. The possibilities and potential is enormous. Web standards advancements with HTML5, CSS3 and the evolution of jQuery shout out “if you’re still disabling java-script you really need to drag yourself into the 21st century”. Otherwise you are dead in the water.
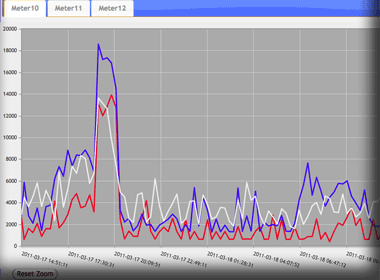
At some stage I may get the chance to write about some of the other fun things jQuery provides, many of which you are probably already using without realizing it, but this post is for jQPlot – an absolutely fabulous implementation of jQuery and custom java-script.
I stumbled upon jQPlot some time back and was blown away with it’s possibilities. We’re currently working towards integrating jQPlot with a database driven power logging and monitoring system.
As part of the process of learning and keeping up to date with jQuery we regularly monitor the jQPlot mailing lists. When questions arise in an area in which we have some expertise or experience, we try to contribute.
In response to questions raised on the jqplot-users list:
I am interested in adding an html link on bar chart?
jQuery / jQPlot method (will open in a new window)
For the CSS method use the same principle described below for labels, selecting the appropriate bar area instead of the labels.
Is it possible to add an html link behind a tick label text?
CSS method (will open in a new window)
Using an image as a graph background?
Still working on documenting this one …
