This poses more of a challenge. The labels text are canvas elements, they don't really exist as clickable text elements. Difficult to wrap an <a href tag around. Especially when rotated.
There are bound to be better canvas specific solutions to be found, sooner or later. But for the moment here's a quick-and-dirty alternative:
1. If you don't already have a background colour set for the jqPlot div do so to make the canvas area visible by (for example) adding background-color: #EEE; to the style attribute of the jqPlot div.
2. Do a quick screen grab of the div area only. It *should* be the same size as the height set in the jqPlot div style attribute.
3. Open the screen grab in a graphics program that can give you the cursor position in relation to the top left of the image. This will let you determine the co-ordinates and calculate the size for the divs containing the links.
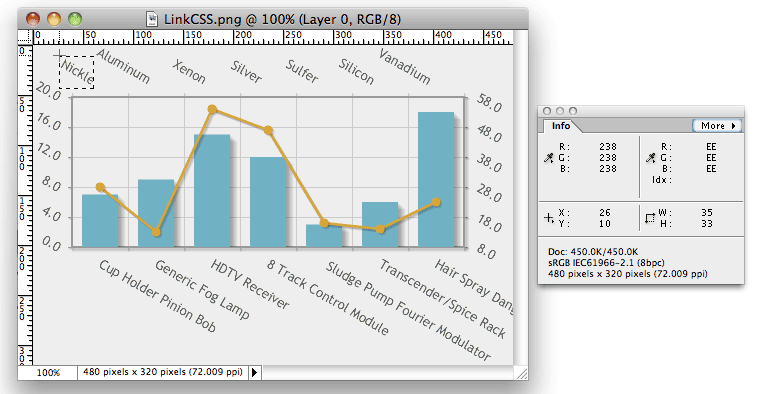
This screen shot below is from Photoshop Elements. Many other graphics utilities will let you do something similar. Notice the selection box around the "Nickle" label top left, the position of the cursor, and the X, Y, W and H read-outs in the info box.
The X and Y co-ordinates of the top left corner of the box give you your CSS top (Y) and left (X) offset. The W and H give you your width and height respectively.
4. In the head of your HTML add the appropriate styles.
5. Inside the jqPlot div, add the appropriate links.
To see the code, view the source of this document.
The link is wrapped around a transparent image (can be a gif or png). This is to make the browsers that don't like empty <a> tags happy.
The <a> tag and image is resized in the style sheet to cover the area you want to make a link. This belt-and-braces approach is made necessary by your old nemesis and mine ie. <sigh>
With a z-index set higher than the plot, the links sit on top and are clickable.
In the working demo based on multiAxesRotatedText.html from the jQPlot Documentation, the top set of axis labels have been linked (all to the same file purely for convenience and speed) and a transparent background is set on hover to indicate where the clickable areas are. The background highlight is purely optional.
Links on the other axis can be set exactly the same way. Just remember to create unique div names for each and apply your own link URLs for ALL links as appropriate.
Most of the bottom row of links in the demo offer a UI friendly alternative for handling awkward sized overlapping areas. A visible "click me" type of graphic of your choice. Otherwise you would need to create an overlapping series of smaller divs for each label as demonstrated on "Cup Holder Pinion Bob".

